Cat Breed Clustering Analysis
Discovering personality patterns across feline breeds using machine learning


Discovering personality patterns across feline breeds using machine learning
The plot below shows different cat breeds clustered based on their overall energy and afffectionate characteristics. Each point represents a cat breed, and the colors indicate different clusters identified through machine learning algorithms.


Given the high-dimensional nature of our trait data, we applied Principal Component Analysis (PCA) to reduce the data to 2 dimensions. This allows us to visualize the relationships between cat breeds while preserving the most important variance in the data.
The two principal components that we plot are defined as linear combinations of the original traits:
PC1 (Overall Energy Level):
PC1 = 0.183 × Affection + 0.538 × Playfulness + 0.481 × Energy + 0.582 × Vocalness + 0.328 × Intelligence
PC2 (Overall Affectionate):
PC2 = 0.588 × Affection - 0.139 × Playfulness - 0.555 × Energy + 0.527 × Vocalness - 0.221 × Intelligence
These components explain the maximum variance in the original 5-dimensional trait space, allowing us to visualize breed relationships in 2D while preserving the most important information.

We used the K-means clustering algorithm to identify natural groupings of cat breeds based on the two principle traits that we have indentified in the previous step. To determine the optimal number of clusters, we employed the Within-Cluster Sum of Squares (WCSS) method, also known as the elbow method.
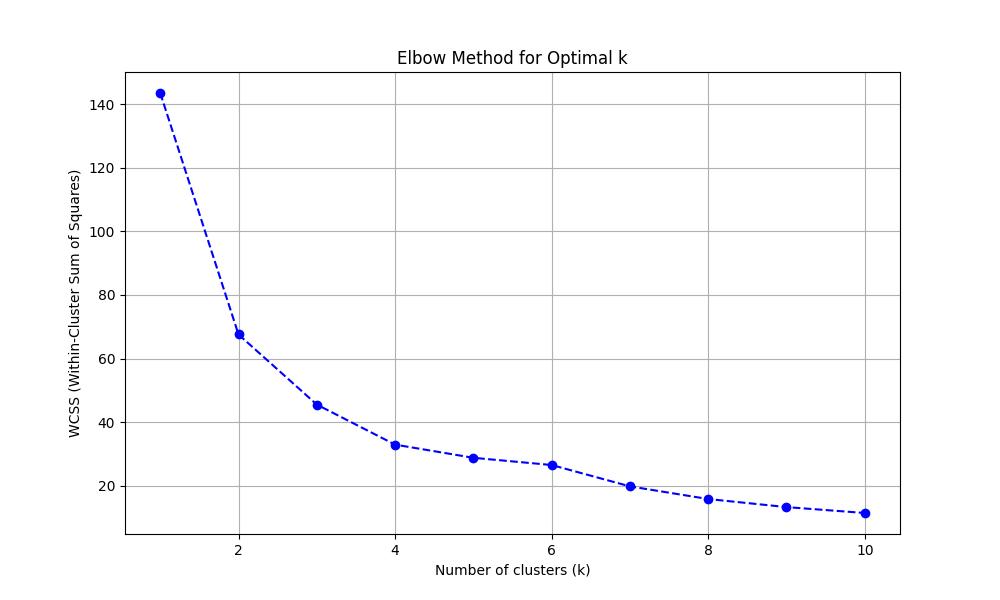
WCSS plot showing the elbow at k=4, indicating the optimal number of clusters
The WCSS plot above clearly shows an "elbow" at k=4, confirming that 4 clusters provide the optimal balance between model complexity and explanatory power for our cat breed dataset.
Our analysis successfully identified 4 distinct clusters of cat breeds based on their overall energy levels and related characteristics:


It is somewhat surprising that affectionate and energy are not independent criteria for the clustering: the naive approach to making 4 clusters would be high/low energy + high/low affectionate. Instead, energy level seems to be a more prominent feature.
This clustering analysis provides valuable insights for perspective cat parents so that they can make informed decisions about which breeds might be the best fit for their living situation, activity level, and lifestyle preferences. If they like one breed which is not available, they can find the similar breeds using our clustering.